# Plot miles per gallon (mpg) as a function of car weight (wt)
plot(mpg ~ wt, data = mtcars)
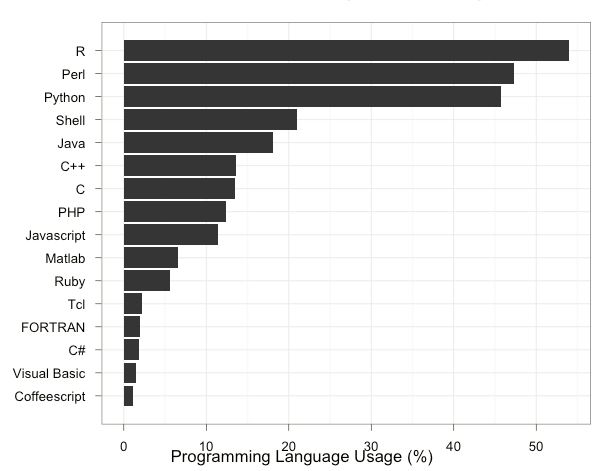
From Bioinformatics survey.
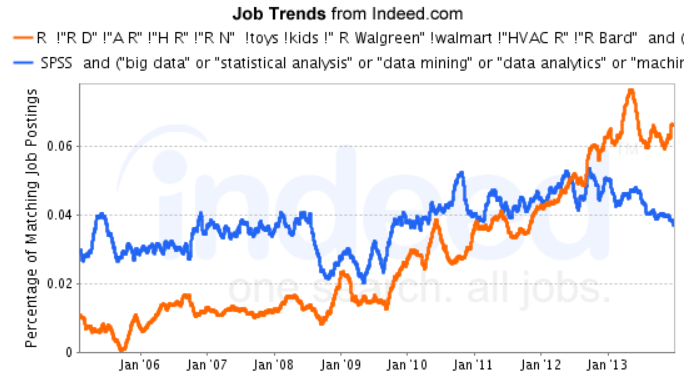
From r4stats.com.
“The best thing about R is that it was written by statisticians. The worst thing about R…” - Bo Cowgill, Google